
Heroku to Grafana
Getting data from Heroku to Grafana has never been easier. Hosted Graphite offers a Heroku add-on that takes data from your Heroku app's logs, ships and ships it to the Hosted Graphite backend for storage and visualization - without ever leaving the Heroku interface. With one click you can have your Heroku data in beautiful Grafana dashboards.
What is Heroku?
Heroku is a cloud Platform as a Service (PaaS) designed to make deploying and operating applications easier. Instead of managing servers and much of the underlying infrastructure yourself, you deploy your application to Heroku and run it inside lightweight containers called dynos.
Applications can use different process types for different jobs. A typical app might have web dynos serving requests, worker dynos processing background jobs, and scheduled processes handling recurring tasks. Heroku also provides managed services such as Postgres, Redis, and Kafka through its ecosystem of add-ons.
As an application grows, all of those components generate useful performance data. Heroku exposes metrics for things like dyno memory and load, HTTP requests, response times, status codes, and supported data services.
That's where Hosted Graphite by MetricFire comes in. The Hosted Graphite Heroku add-on is available directly through the Heroku Elements Marketplace and automatically turns supported Heroku performance data into actionable Graphite metrics. Once the add-on is installed, those metrics are sent to your Hosted Graphite account and automatically populated into Grafana dashboards. That means you can go from running an application on Heroku to graphing its dynos, processes, router traffic, Postgres, Redis, Kafka, and other supported metrics without building a separate monitoring pipeline yourself.
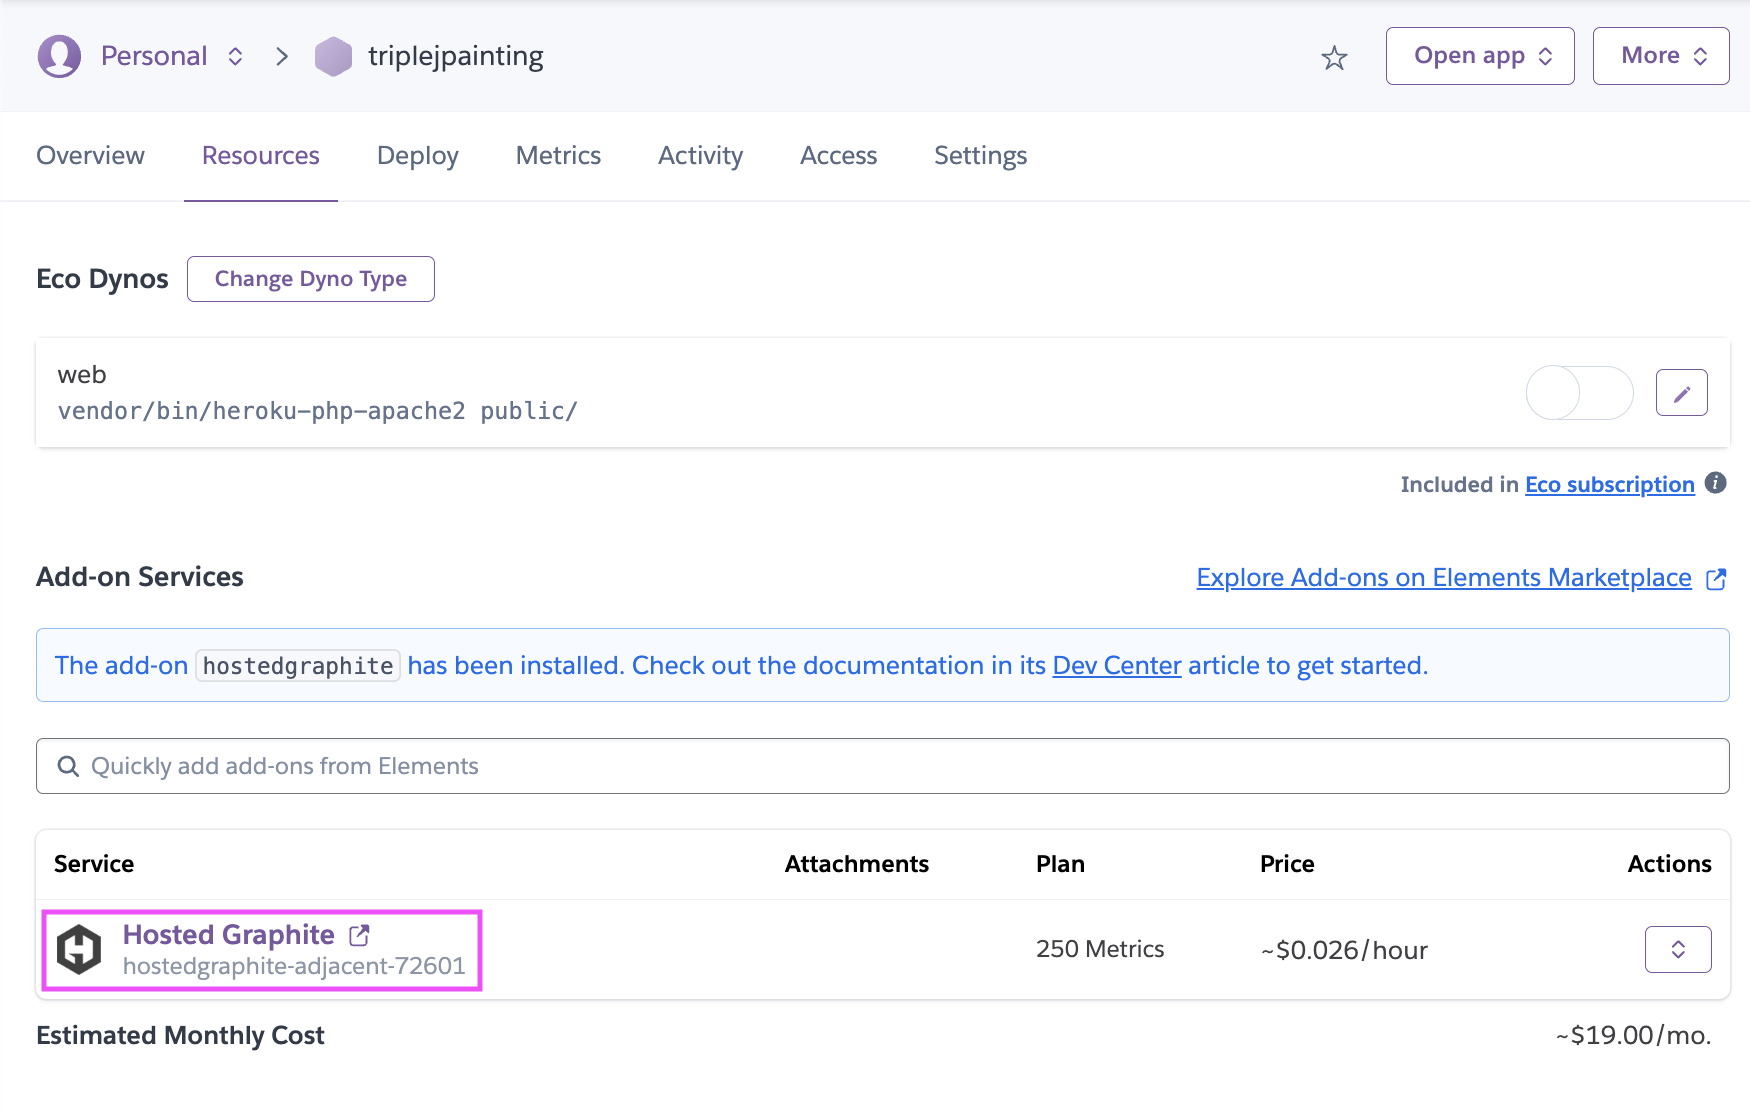
You can also send custom application metrics into the same Hosted Graphite account, letting you monitor what's happening inside your application alongside the Heroku infrastructure running it. For more details on what's collected and how the integration works, check out the Hosted Graphite Heroku documentation.
What is Grafana?
Grafana is an open-source visualization platform used to turn time-series data into dashboards, graphs, tables, and other visualizations. Grafana doesn't store your metrics itself. Instead, it connects to a data source, queries the data stored there, and displays the results in dashboard panels.
With Hosted Graphite, Graphite is the data source and Grafana is the visualization layer. Hosted Graphite handles the collection, storage, aggregation, and querying of your metrics, while Grafana gives you a flexible interface for exploring that data. Every Hosted Graphite plan includes our managed Grafana dashboards, so there's no separate Grafana server for you to install or maintain. You can build custom dashboards, apply Graphite functions to metric queries, change visualization types, create dashboard variables, add event annotations, adjust time ranges, and configure auto-refreshing dashboards for live monitoring. For example, a Grafana panel could query a single Graphite metric:
heroku.my-app.router.service
Or use a wildcard to graph a whole group of related metrics:
heroku.my-app.router.status.*
You can then apply Graphite functions to aggregate, filter, summarize, or transform those series before they're displayed. Hosted Graphite's Grafana implementation supports functions such as summarize(), aliasByNode(), groupByNode(), movingAverage(), and many others.
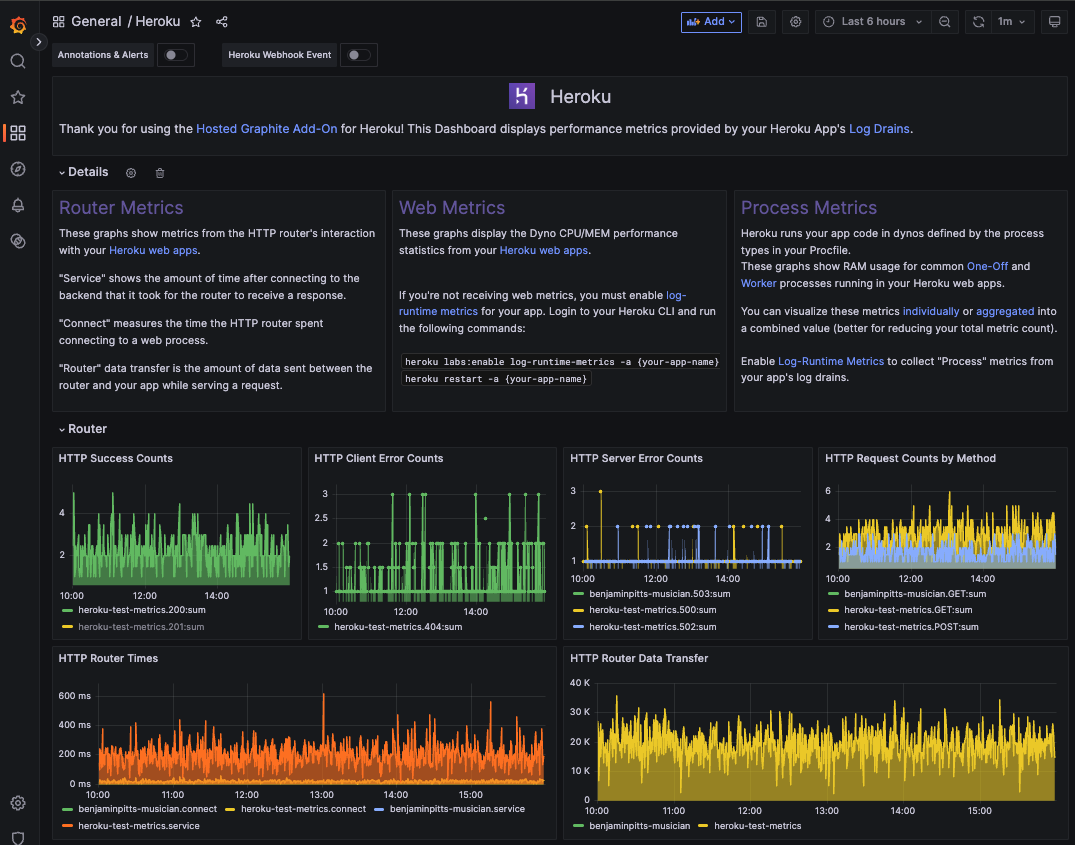
If you're using the Hosted Graphite Heroku add-on, you don't even need to build your first dashboard from scratch. A Heroku dashboard is automatically created when the integration is enabled, with panels for supported metrics such as dyno CPU and memory, router traffic, HTTP methods and status codes, and process metrics:
Getting data out of Heroku
With the Hosted Graphite Heroku monitoring add-on, there's no need to get your data out of Heroku. You get your data from Heroku to Hosted Graphite to Hosted Grafana in one click and if you don't believe us, check out our blog post here.
Preparing Heroku data
With the Hosted Graphite Heroku monitoring add-on, you don't need to do any preparation for your data. The add-on will know which data to pipe into the app to get you started. After the Heroku automatic dashboard is added to your account, you can start to customize the dashboards to show the data you're interested in. You can even pull AWS, Azure, GCP, and DigitalOcean metrics into your new Hosted Graphite account!
Forwarding Heroku metrics into Grafana
Installing and opening the Hosted Graphite monitoring add-on can be done through the Heroku UI Resources Tab, or by issuing two commands from within your Heroku CLI:
- heroku addons:create hostedgraphite -a [app-name]
- heroku addons:open hostedgraphite -a [app-name]
Analyzing data in Grafana
Grafana prepares you to analyze data with ease. You can build dashboards with several different kinds of panels, and you can run alerts and time-series forecasting. Check out some of our resources here on Grafana:
The best part about using the Heroku Hosted Graphite Monitoring Add-on is the support. The HG engineering team can help you with anything you need related to getting your data from Heroku into Grafana. If you have any questions about Heroku monitoring, just reach out to us in the intercom chat inside the HG account!
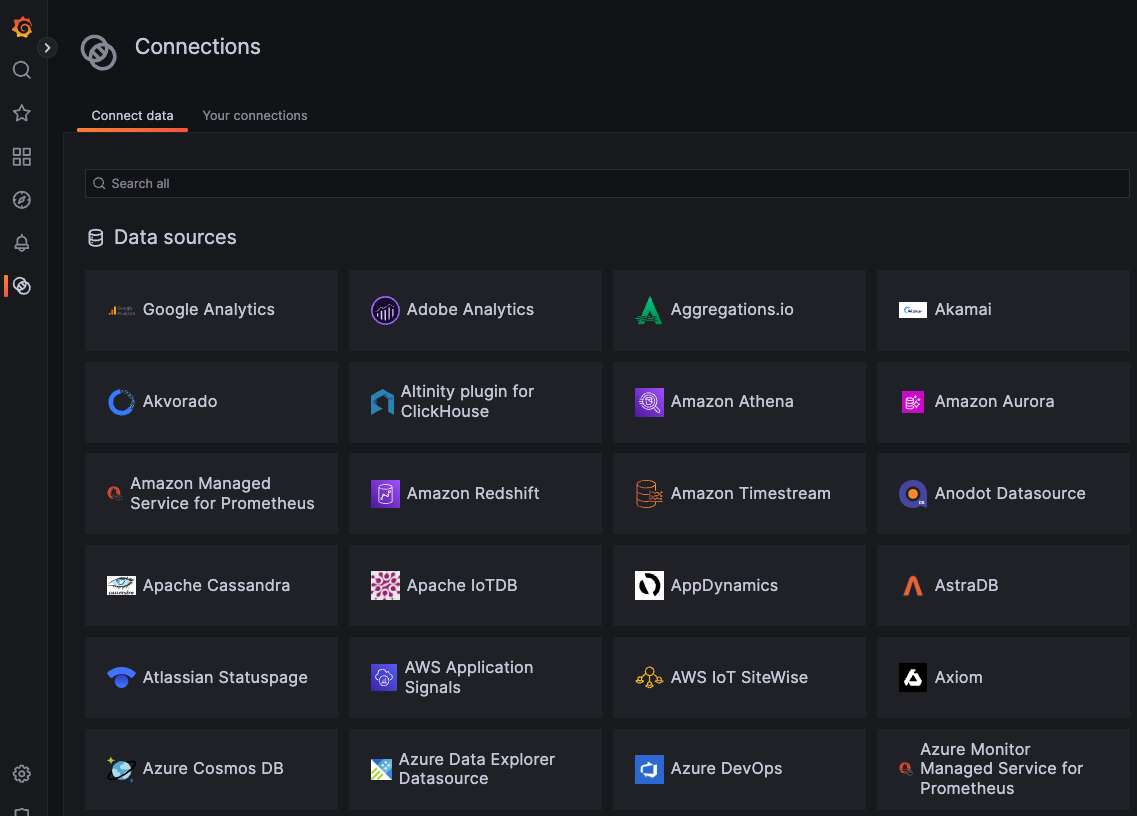
With Hosted Graphite's Grafana, you can also create additional Data Sources and connect to your external instances of PostgreSQL, MQTT, Cloudwatch, RabbitMQ, InfluxDB, Prometheus, Victoria Metrics, and many more!
Keeping your Heroku data up to date
With the HG Heroku monitoring tool, you don't need to worry about keeping your data up to date, and you don't need to worry about maintaining your Grafana installation. We take care of everything for you as a part of the natural maintenance of the service. If you need a specific version of Grafana, we can deploy that for you. If you need a custom URL for your Grafana environment, we can do that for you too!
From Heroku to our data warehouse: An easier solution
You don't need to worry about maintaining a storage solution or scaling when you use the Heroku Hosted Graphite add-on. Your data storage is a part of the service and is available to you at any time - with no vendor lock-in.
The Hosted Graphite Heroku add-on is the easiest way to monitor your Heroku apps. Don't bother doing it yourself when you can get a hosted solution to do it for you, starting at only $19/mo. Reach out to us at support@hostedgraphite.com to learn more!


.png)

.svg)