
Real-Time Heroku Monitoring
When something starts going wrong with a production application, five minutes can be a pretty long time.
A sudden increase in HTTP 5XXs, a worker running out of memory, or a backed-up database can start affecting users quickly. Real-time monitoring is about getting those signals into your monitoring system fast enough that you can see what's happening and, more importantly, get alerted before a small problem turns into a larger one.
The Heroku Hosted Graphite Monitoring Add-on automatically converts supported Heroku performance data into Graphite metrics, where they can be visualized in Grafana and monitored with Hosted Graphite composite alerts.
From Heroku Logs to Graphite Metrics
Heroku exposes a lot of useful information through its log stream and Hosted Graphite converts those events into metrics for many Heroku services, including:
- Router: request traffic, response times, HTTP methods, and status codes
- Dynos: web memory usage and CPU load
- Postgres, Redis, and Kafka Add-ons: database and server performance
- Processes: workers, schedulers, releases, and other process types
- Heroku Connect: synchronization timings and operations
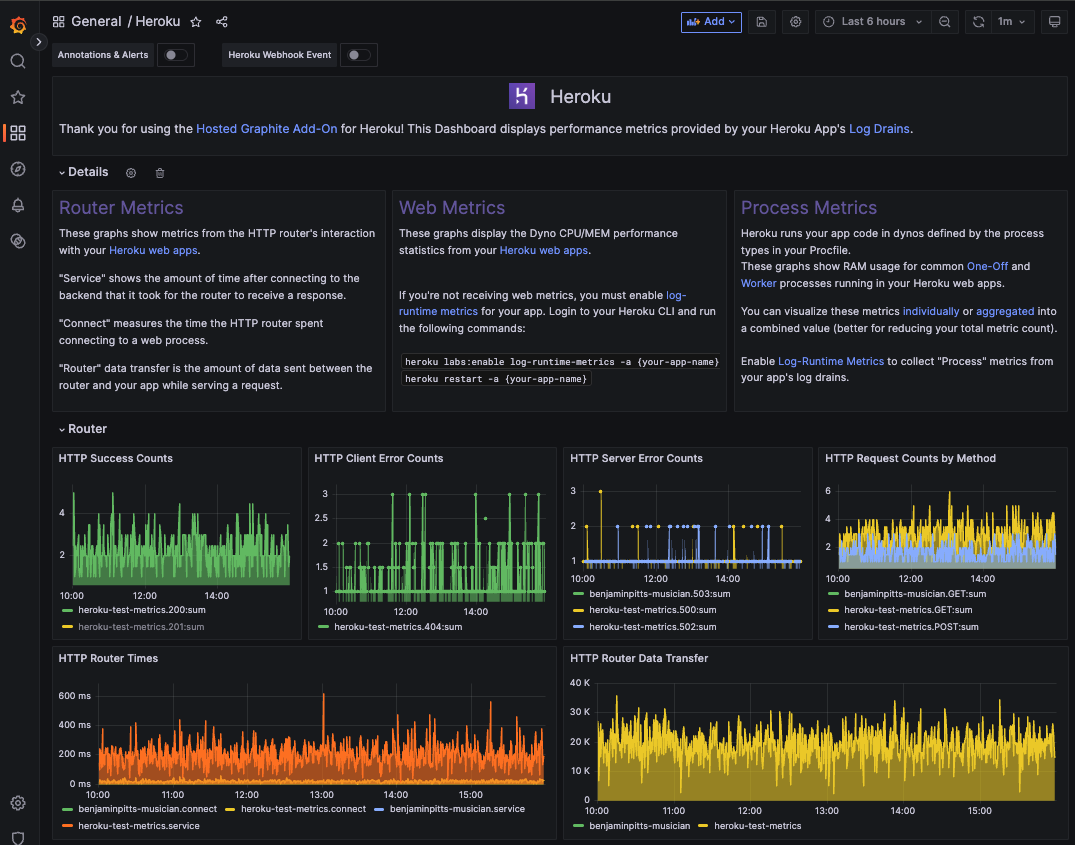
Instead of digging through individual log messages, you end up with time-series metrics that can be queried, graphed, and alerted on. For example, router activity can produce metrics such as:
heroku.my-app.router.service
heroku.my-app.router.status.{2*, 4* , 5* }
heroku.my-app.router.method.{GET, PUT, POST, DELETE}
Viewing these metrics side-by-side makes it much easier to understand whether something is an isolated event, or part of a larger issue:
How Quickly Does New Data Appear?
There's always some processing between a datapoint being generated and that datapoint appearing on a graph. With Hosted Graphite by MetricFire, new data typically takes around 60 seconds to travel through several ingestion and storage layers before it becomes queryable from our data storage backend. That pipeline looks roughly like this:
Heroku => log stream => HG ingestion endpoint => aggregation/storage => Graphite metric query => Grafana dashboard
So when we talk about "real-time" monitoring, we aren't claiming that a datapoint generated this millisecond magically appears in Grafana the next one. In practice, you're usually looking at about a minute between new data arriving and being available to query and visualize. For operational monitoring, that's still plenty fast enough to watch application behavior develop as it happens without constantly hammering your production infrastructure with monitoring queries.
To install the Hosted Graphite add-on and start monitoring your app in minutes, simply run the following commands from within your Heroku CLI:
- heroku addons:create hostedgraphite -a <app-name>
- heroku addons:open hostedgraphite -a <app-name>
Alerts Don't Have to Wait for Grafana
There's an important difference between graphing a metric and alerting on a metric.
Grafana alerting is generally query-based because it periodically evaluates a query against its datasource, renders the result of that evaluation, and determines whether the alert condition has been met. HG's native Graphite alerting works differently though.
Our alerting system evaluates incoming metric data during ingestion rather than waiting for a Grafana render query.
That distinction matters because a new datapoint may still be working its way through the storage pipeline before it's available for a normal Graphite query, but the alerting system has already seen that datapoint come through ingestion. That means we don't necessarily have to wait for:
ingestion => storage => query => alert evaluation
Instead, the alert can begin evaluating the new data as it's being ingested. For monitoring where notification speed matters, cutting the query/render step out of the alerting path can get the problem in front of your team faster:

Real-Time Monitoring Is More Than One Metric
Getting data quickly is useful but getting useful context quickly is better. Suppose your application's response times suddenly increase. A Grafana dashboard could display panels for:
increasing heroku-postgres.waiting-connections
And at the same time, you might see:
router.status.5* also increasing
as well as:
high dyno web.memory_rss consumption
Now you've got a much more useful picture which is more actionable than receiving an alert that simply says "response time is high." You need to know WHY the response time is high and Hosted Graphite can help give you that additional context.
Reduce Noise With Composite Alerts
This is also where Hosted Graphite's composite alerting becomes useful. Instead of notifying your team whenever one metric briefly crosses a threshold, you can combine related conditions using AND / OR logic. For the above example of increased Postgres waiting connections, 5XX events, and dyno RAM, you could define a criteria for all 3 to create a service-level alert that notifies when you when any 1 of these signals is reporting an increase in its values.
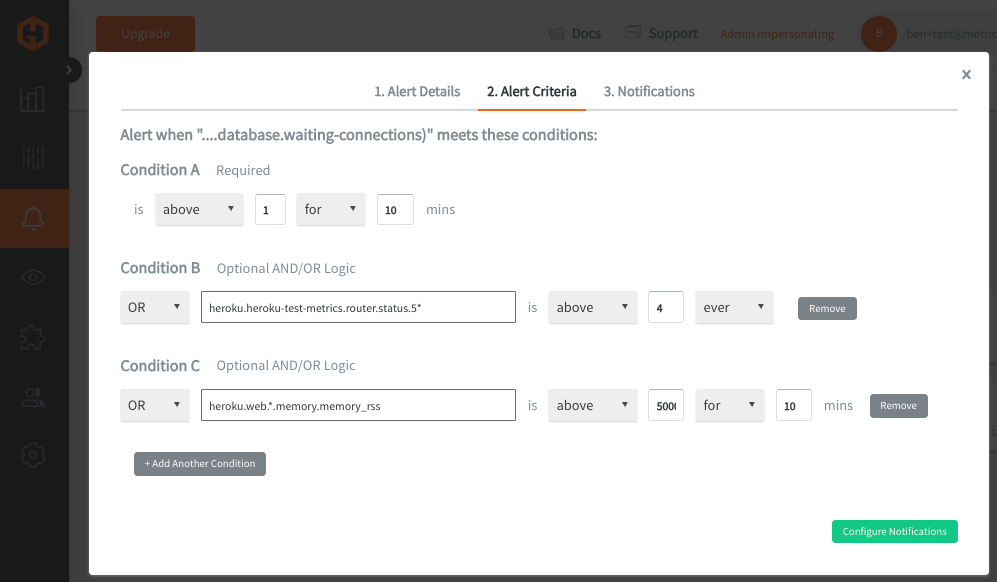
A short spike in one metric might not mean much but multiple related signals changing together provide much stronger evidence that something is actually affecting the application. That lets you keep the speed of real-time alerting without turning every temporary spike into another Slack or PagerDuty notification.
Monitor the Application, Not Just Heroku
Heroku metrics can tell you quite a bit about the infrastructure around your application, but they don't necessarily tell you whether the application itself is doing its job. Hosted Graphite also lets you send custom application metrics alongside the automatically collected Heroku data. A worker application might send:
jobs.processed
jobs.failed
queue.depth
job.processing_time
And an ecommerce application might send:
checkout.requests
checkout.errors
checkout.latency
Now a Grafana dashboard can show the application's own behavior alongside its Heroku infrastructure. If checkout.errors suddenly increases, you can immediately compare it against router response times, HTTP status codes, dyno memory, Postgres performance, or Redis activity. That's where monitoring becomes a lot more useful than simply watching whether a server is alive. Reach out to us at support@hostedgraphite.com to learn how to use our Language Guide to send custom metrics from within your application code.
Real-Time Dashboards Without a Self-Hosted Monitoring Stack
Of course, collecting all of this data creates another problem: somebody has to store and query it. The Heroku Hosted Graphite monitoring Add-on manages the Graphite and Grafana infrastructure behind the Heroku add-on, so you don't need to operate another stack alongside your application.
Install the add-on, and Heroku metrics are automatically ingested into Hosted Graphite with Grafana dashboards available for visualization. From there, you can cretae your own dashboards and alerts, send custom metrics, and send metrics from other parts of your infrastructure (AWS, Azure, GCP, DigitalOcean).
The goal isn't to stare at Grafana all day waiting for something to move. It's to have current metrics available when you need them, and alerts polling defined metric thresholds - so you don't have to. You can get started by installing the Heroku Hosted Graphite add-on today, and check out the Hosted Graphite Heroku documentation for more details.


.png)

.svg)